Starting a Chat
Click New Chat in the sidebar to start a conversation. Each chat is saved and accessible from the sidebar.Asking Questions
Type your question in plain English:Understanding Responses
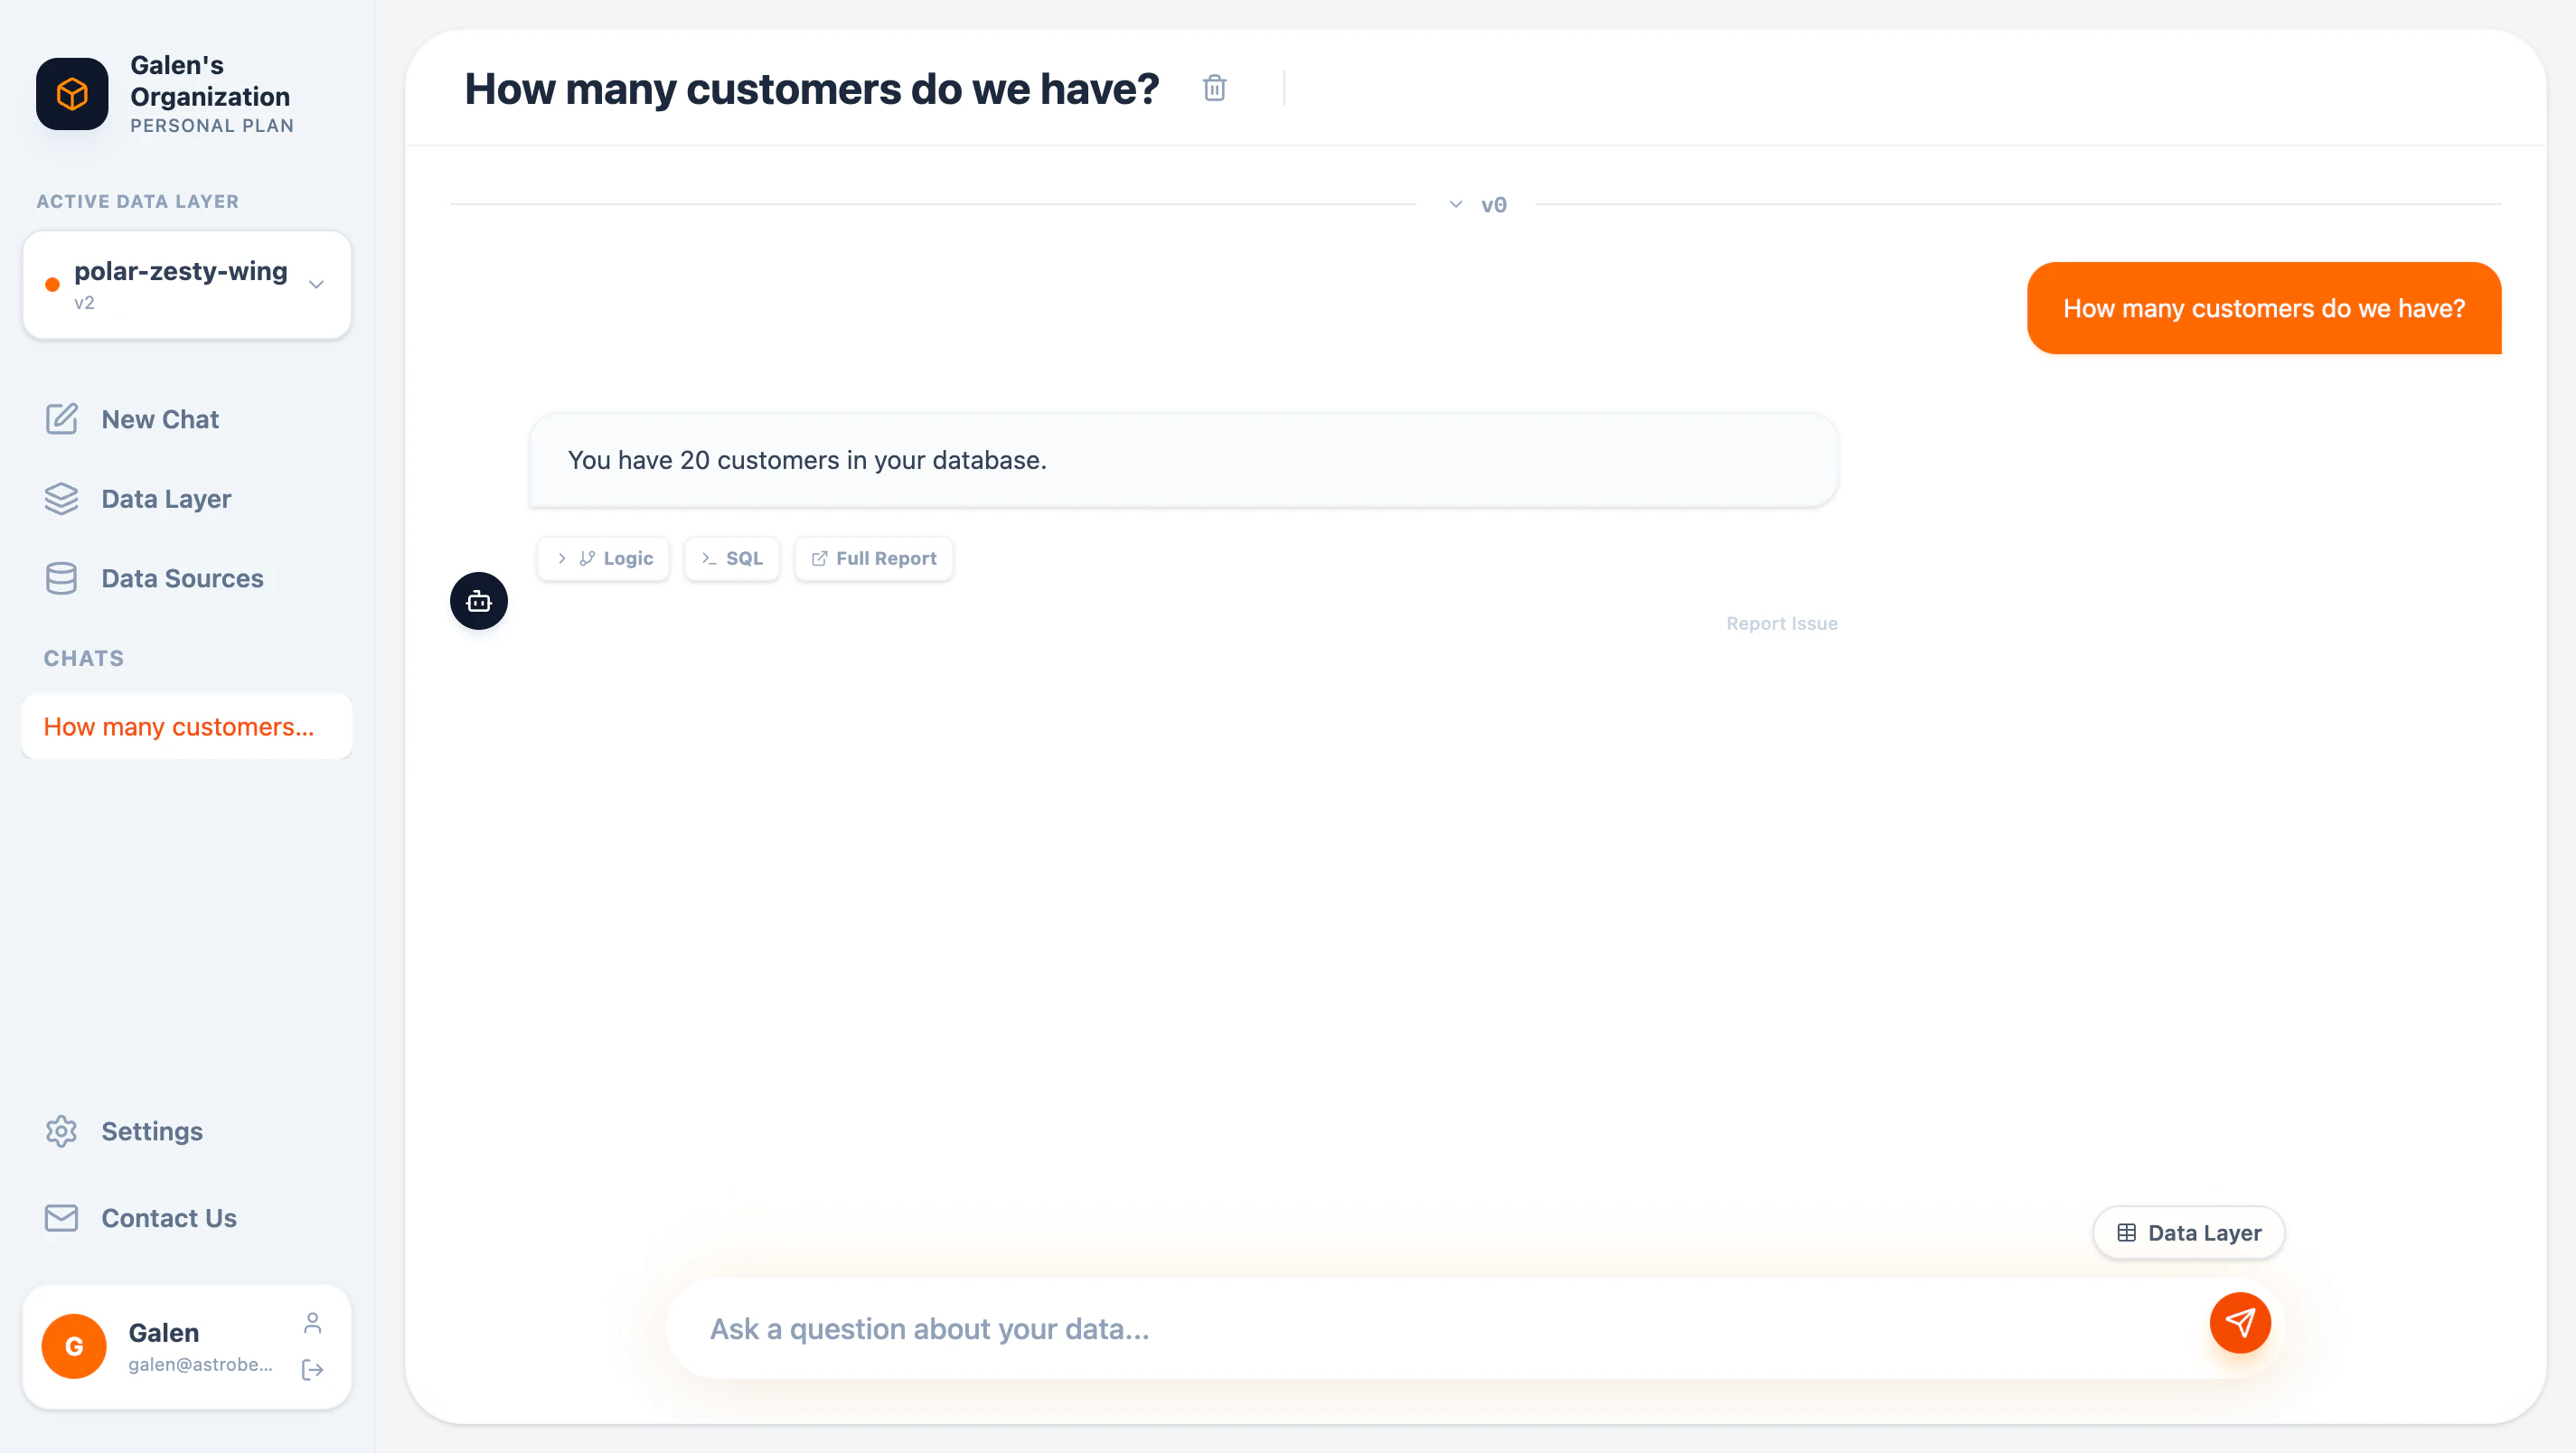
Each response includes multiple views:Answer
The direct answer to your question in natural language:You have 20 customers in your database.
SQL View
Click SQL to see the exact query AstroBee generated: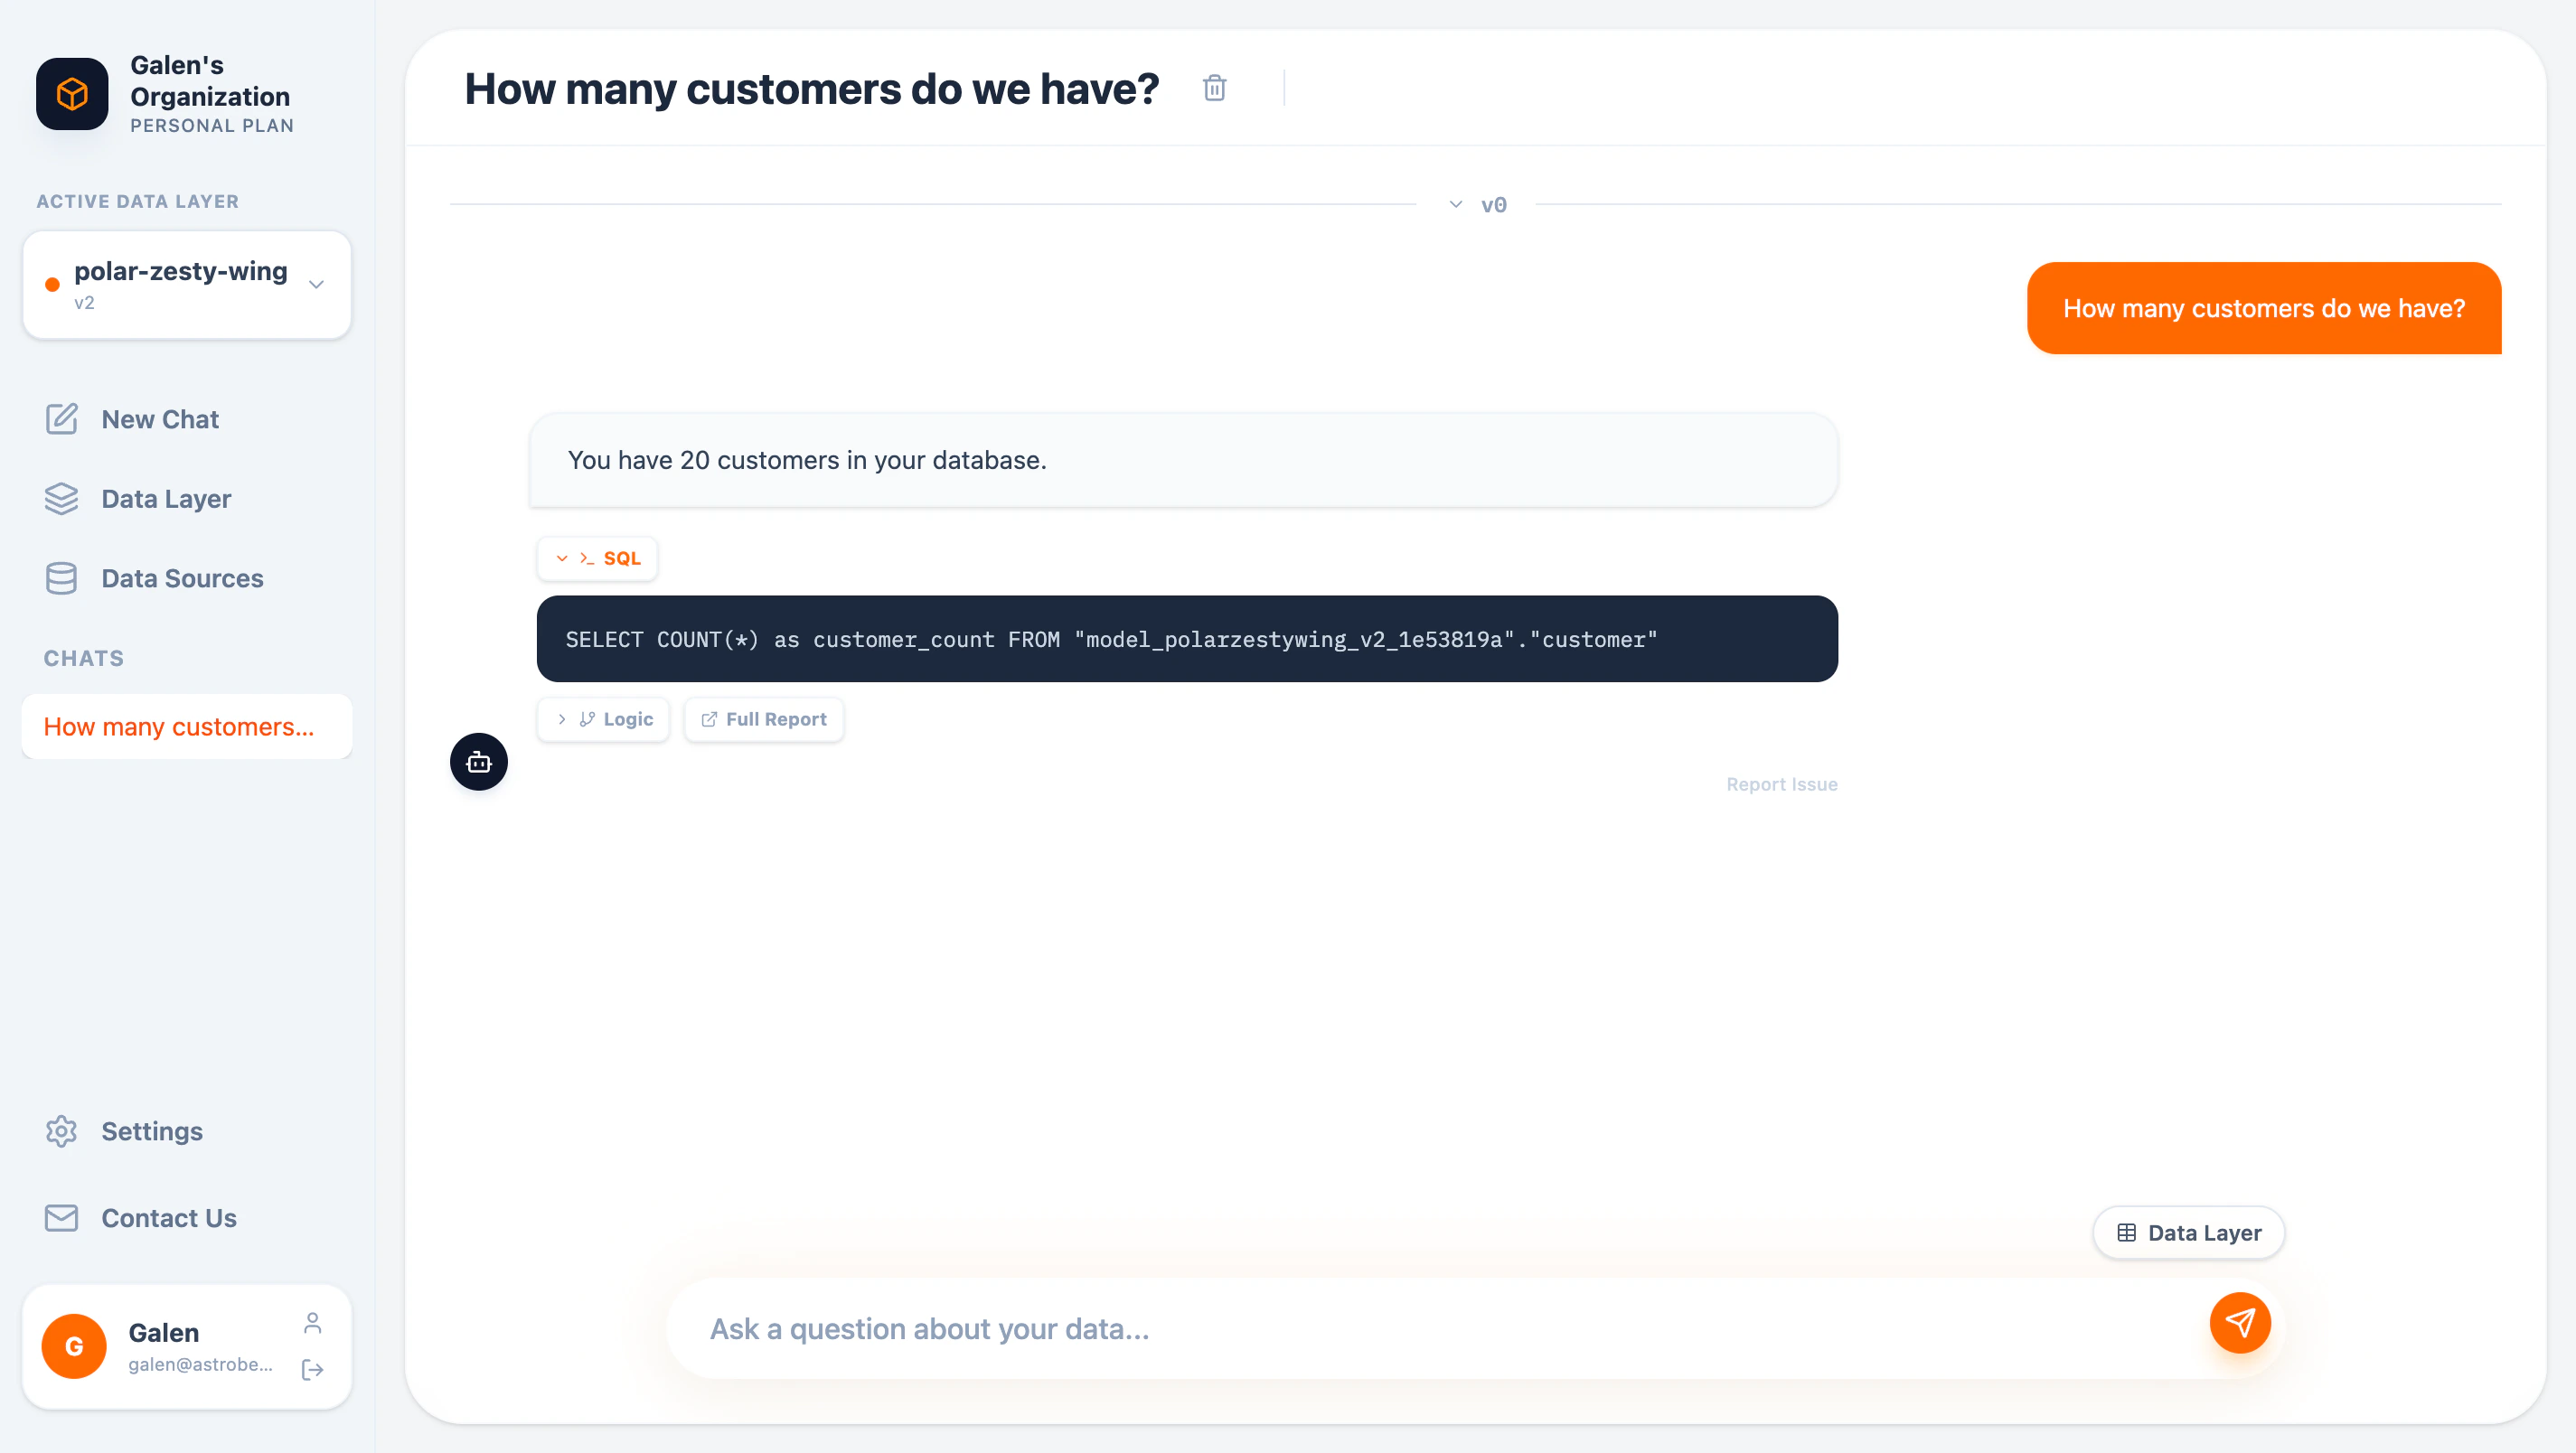
- Which tables and entities were queried
- Join conditions used
- Aggregations and filters applied
Logic View
Click Logic to understand AstroBee’s reasoning: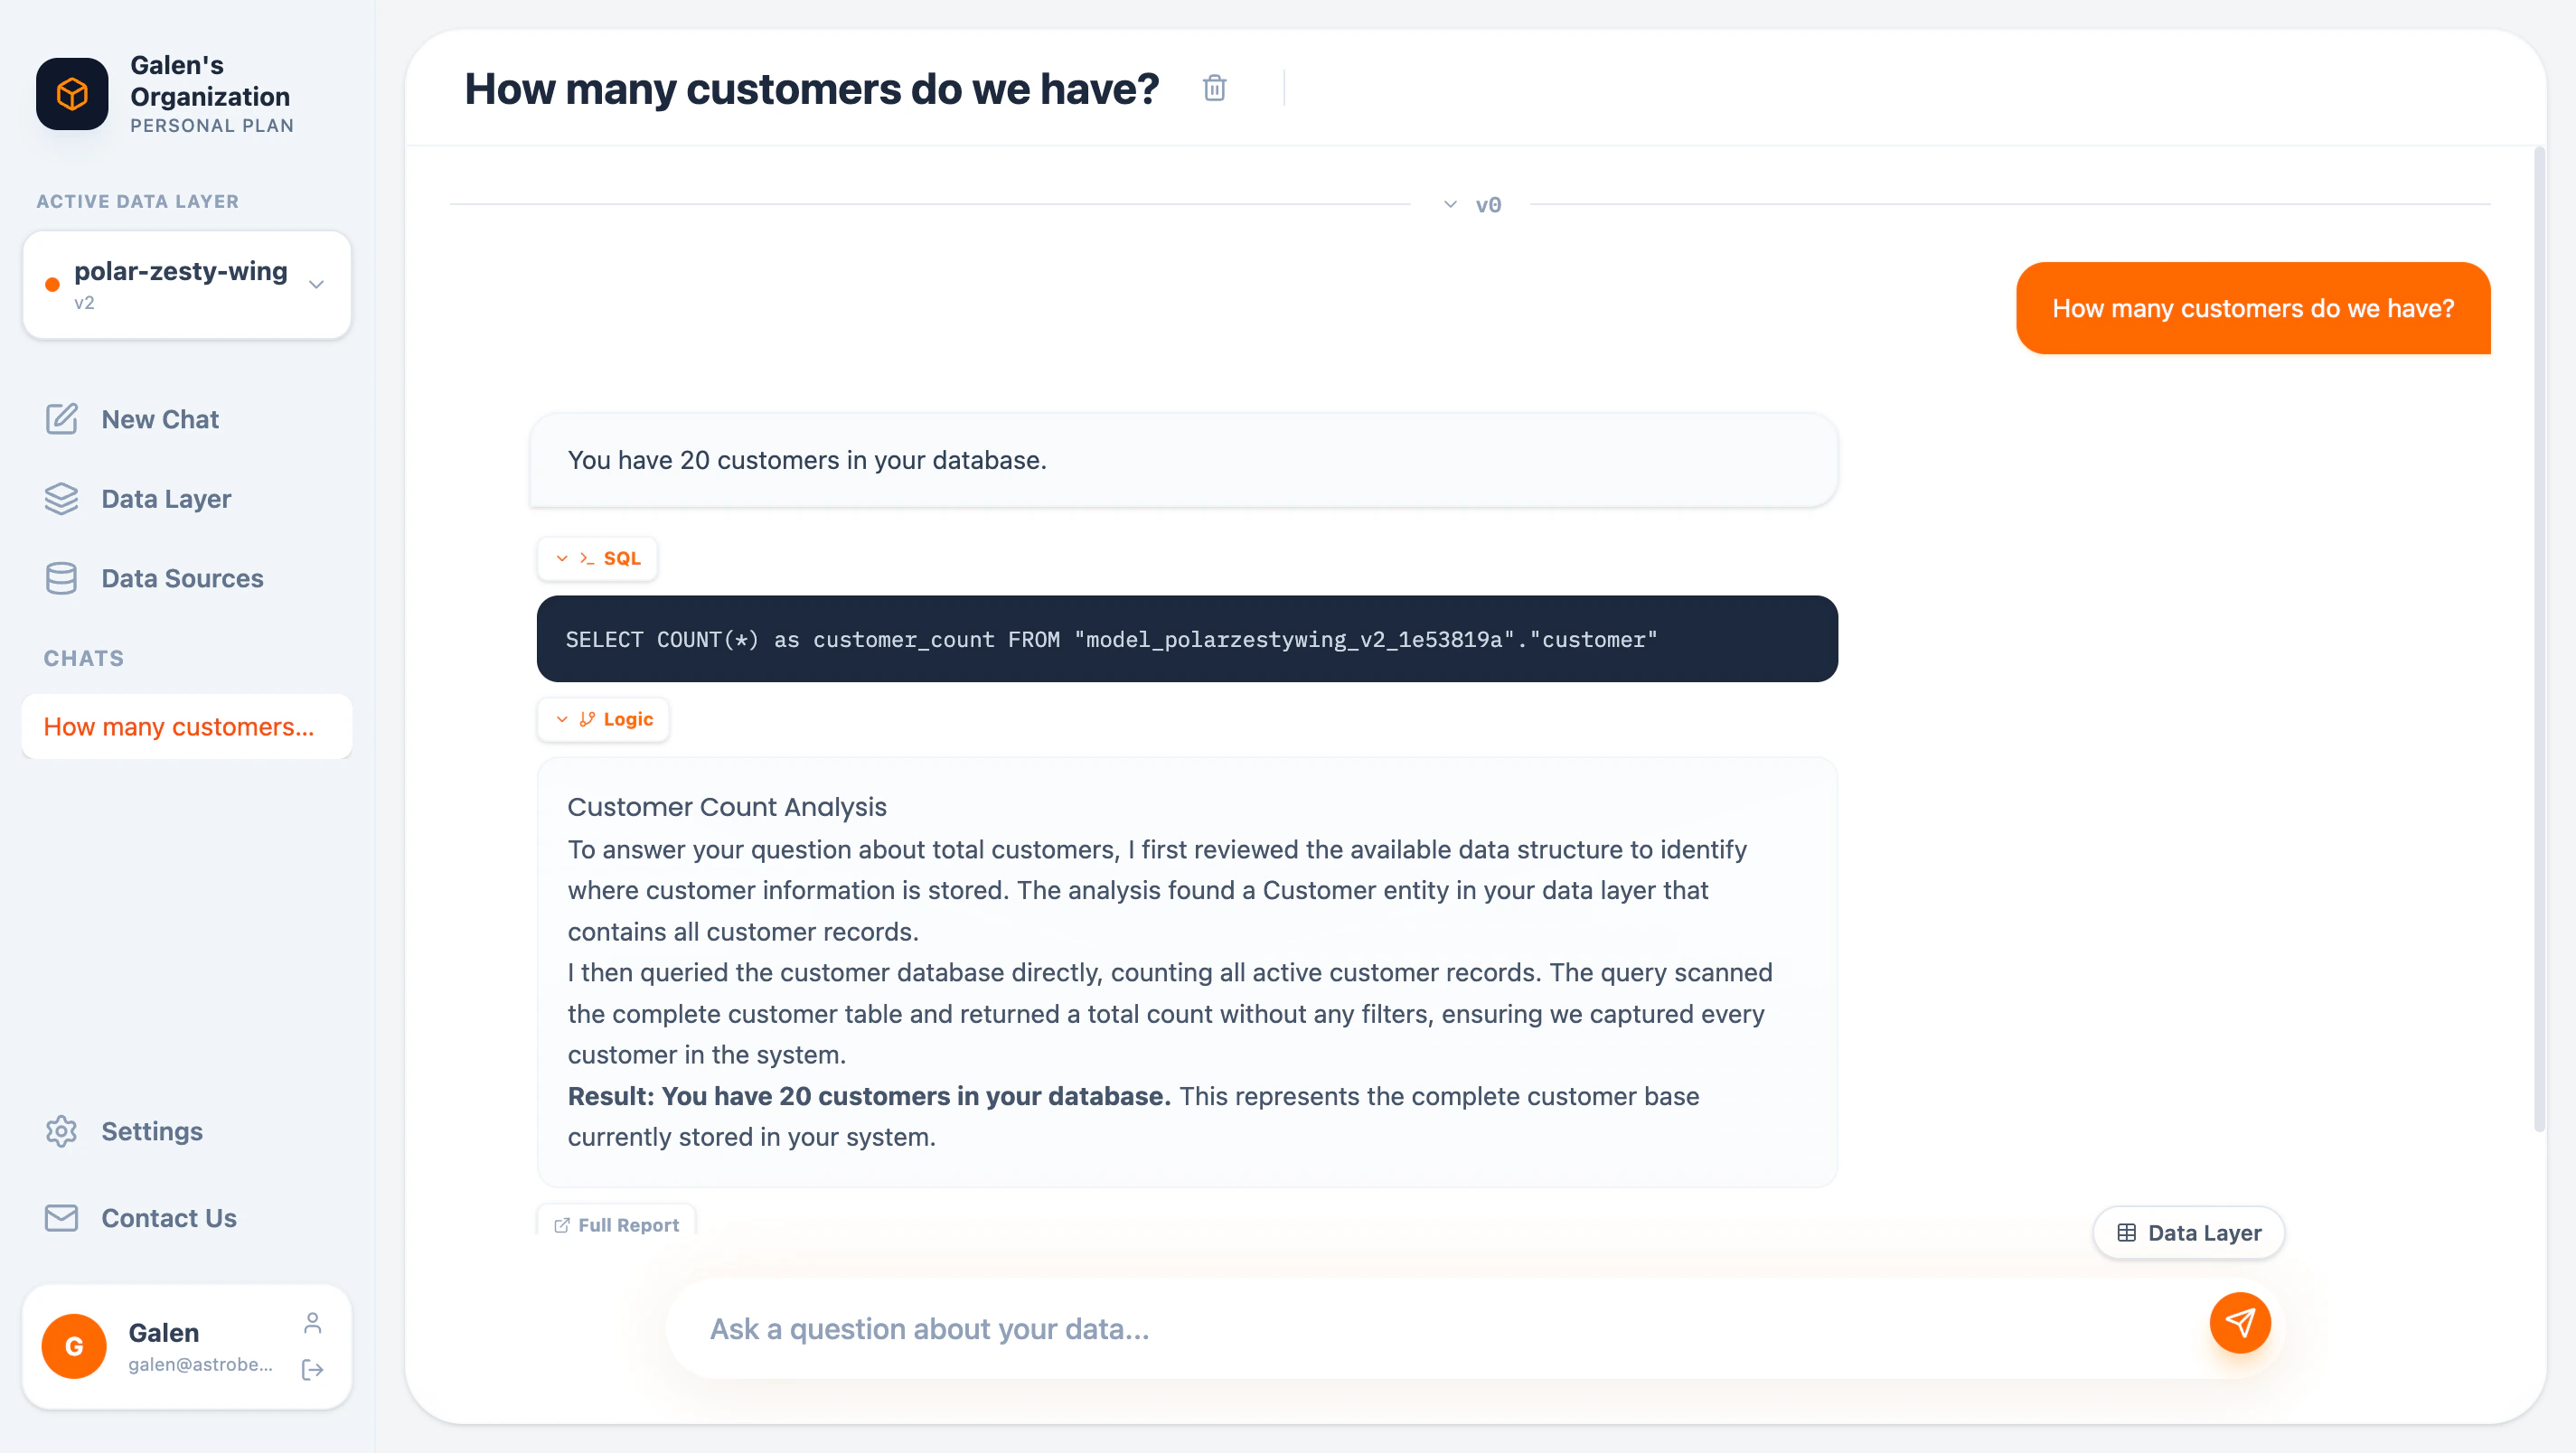
- How AstroBee interpreted your question
- Which entities and relationships it used
- Why it chose that particular approach
Full Report
Click Full Report for a complete breakdown: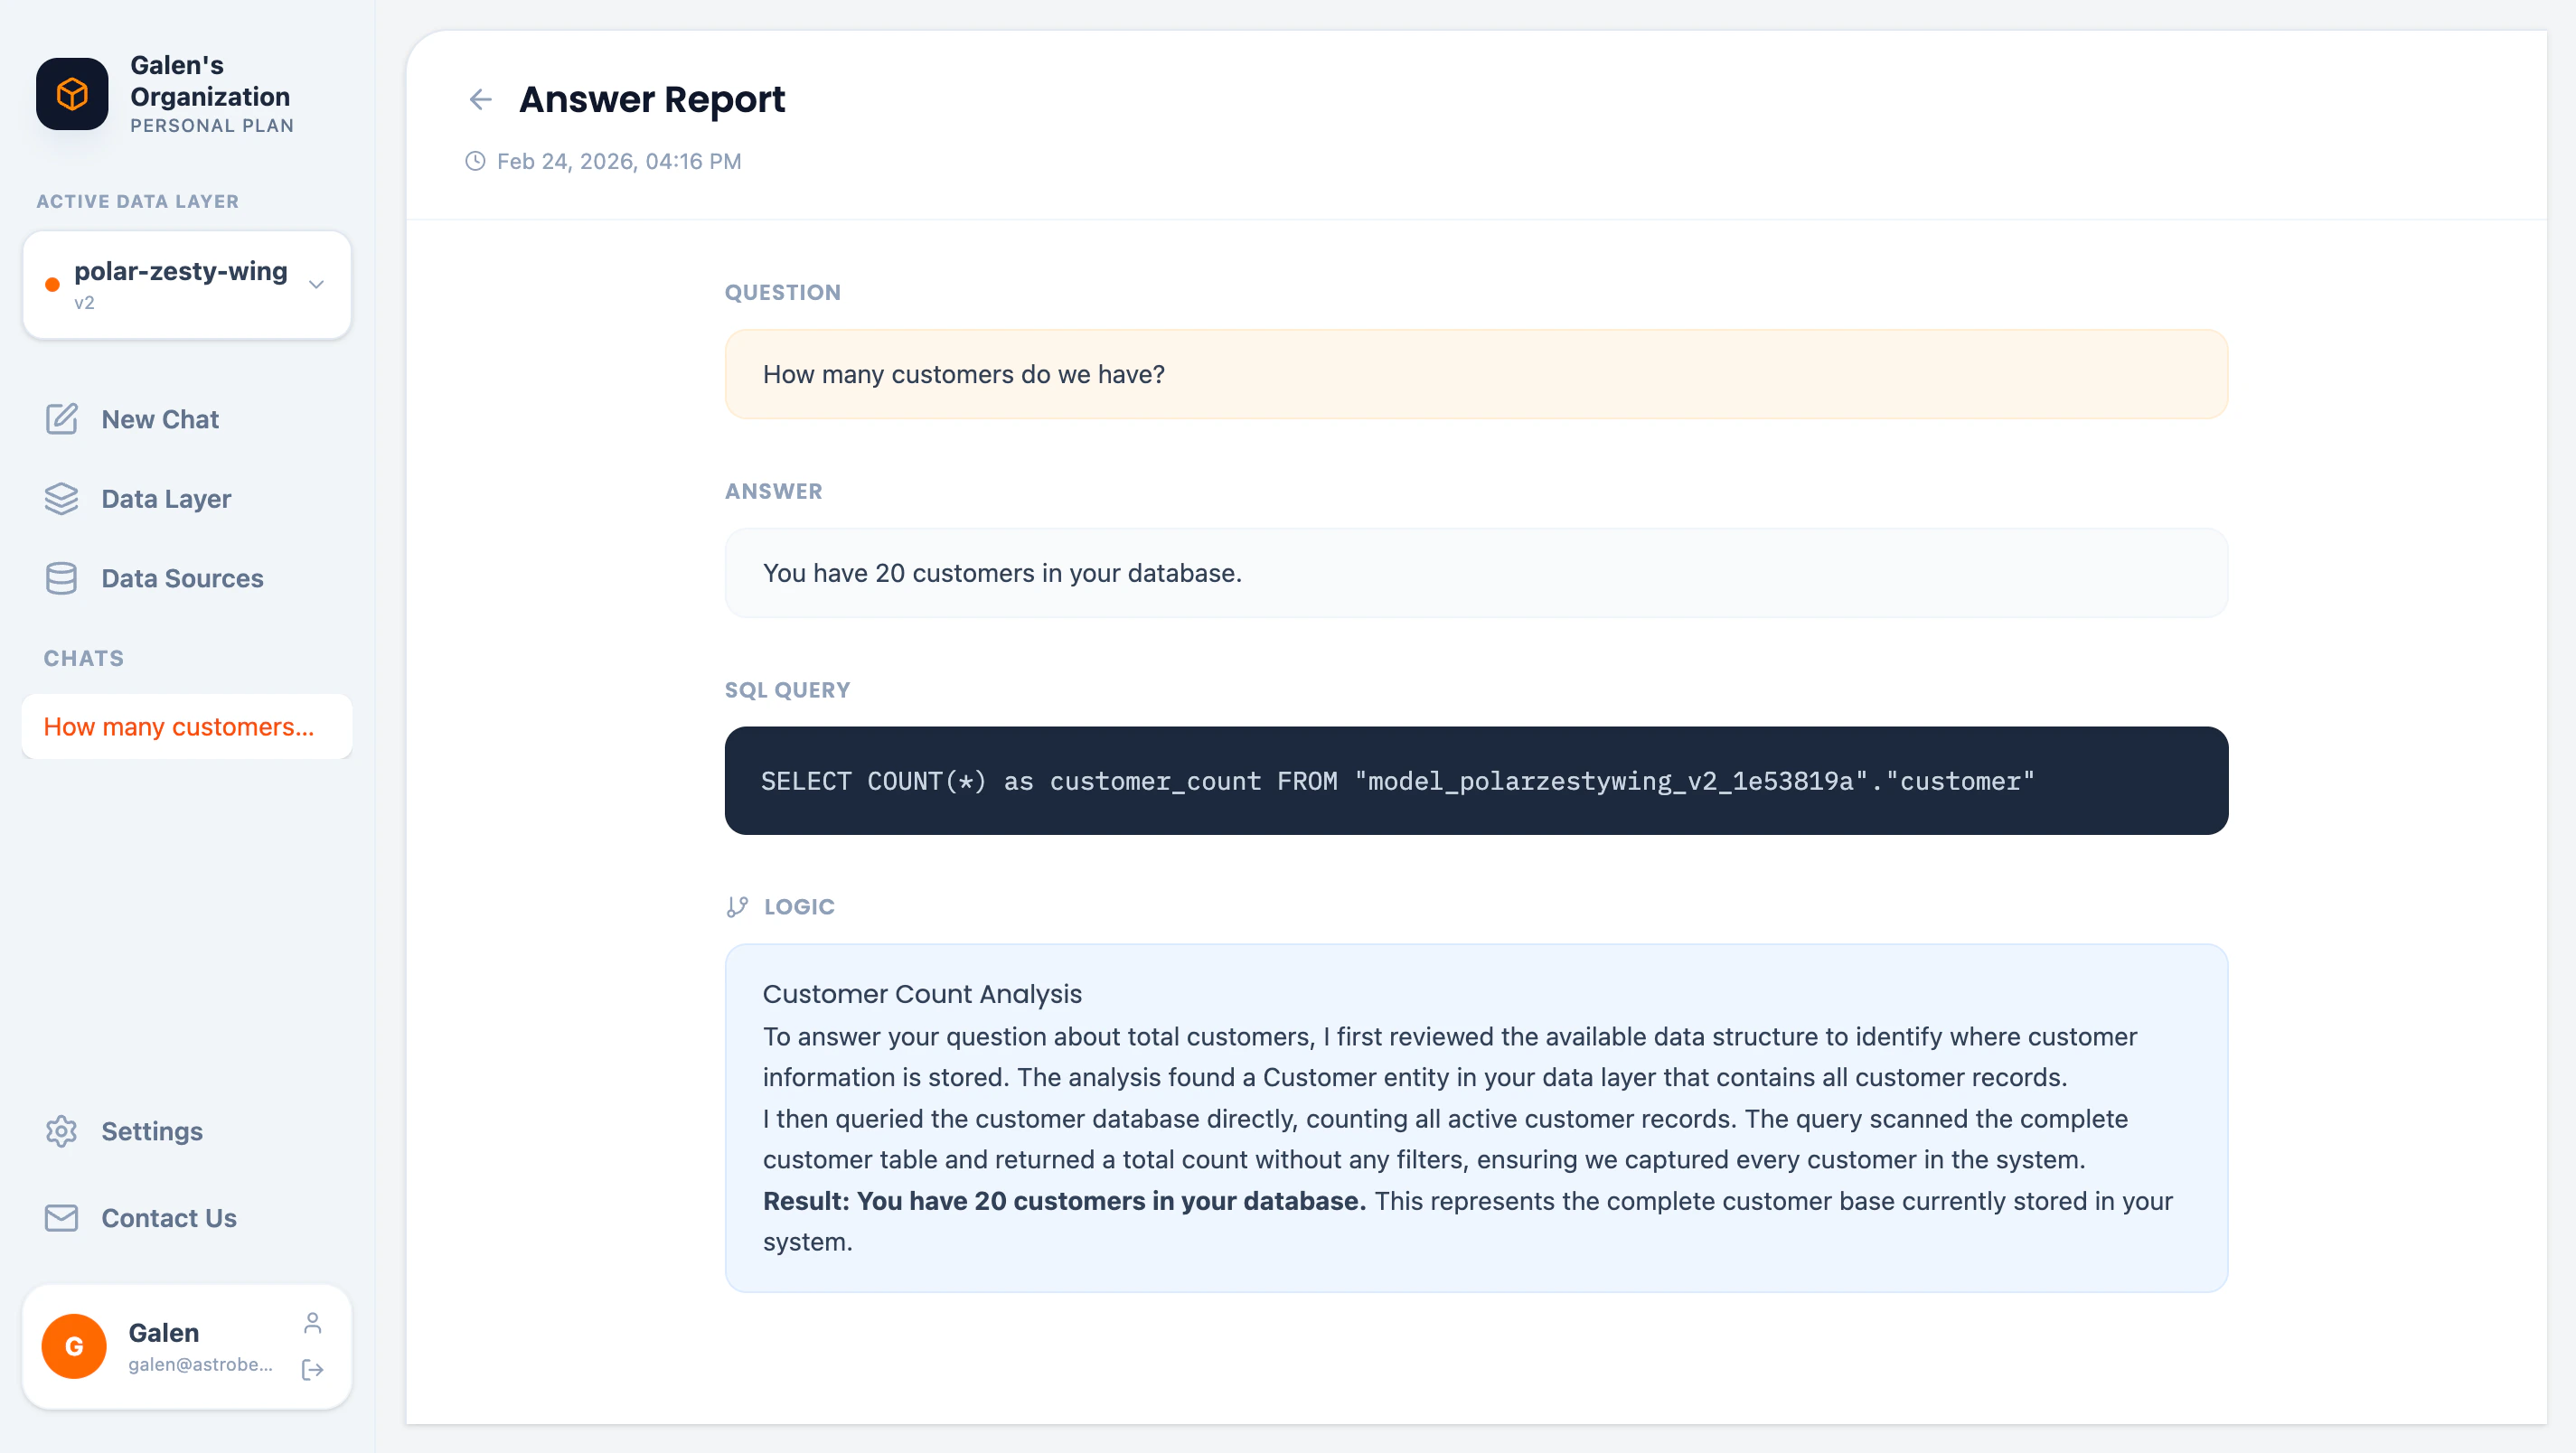
- Original question
- Answer
- SQL query
- Full logic explanation
- Timestamp
Browsing the Data Layer
While chatting, click Data Layer to browse available entities: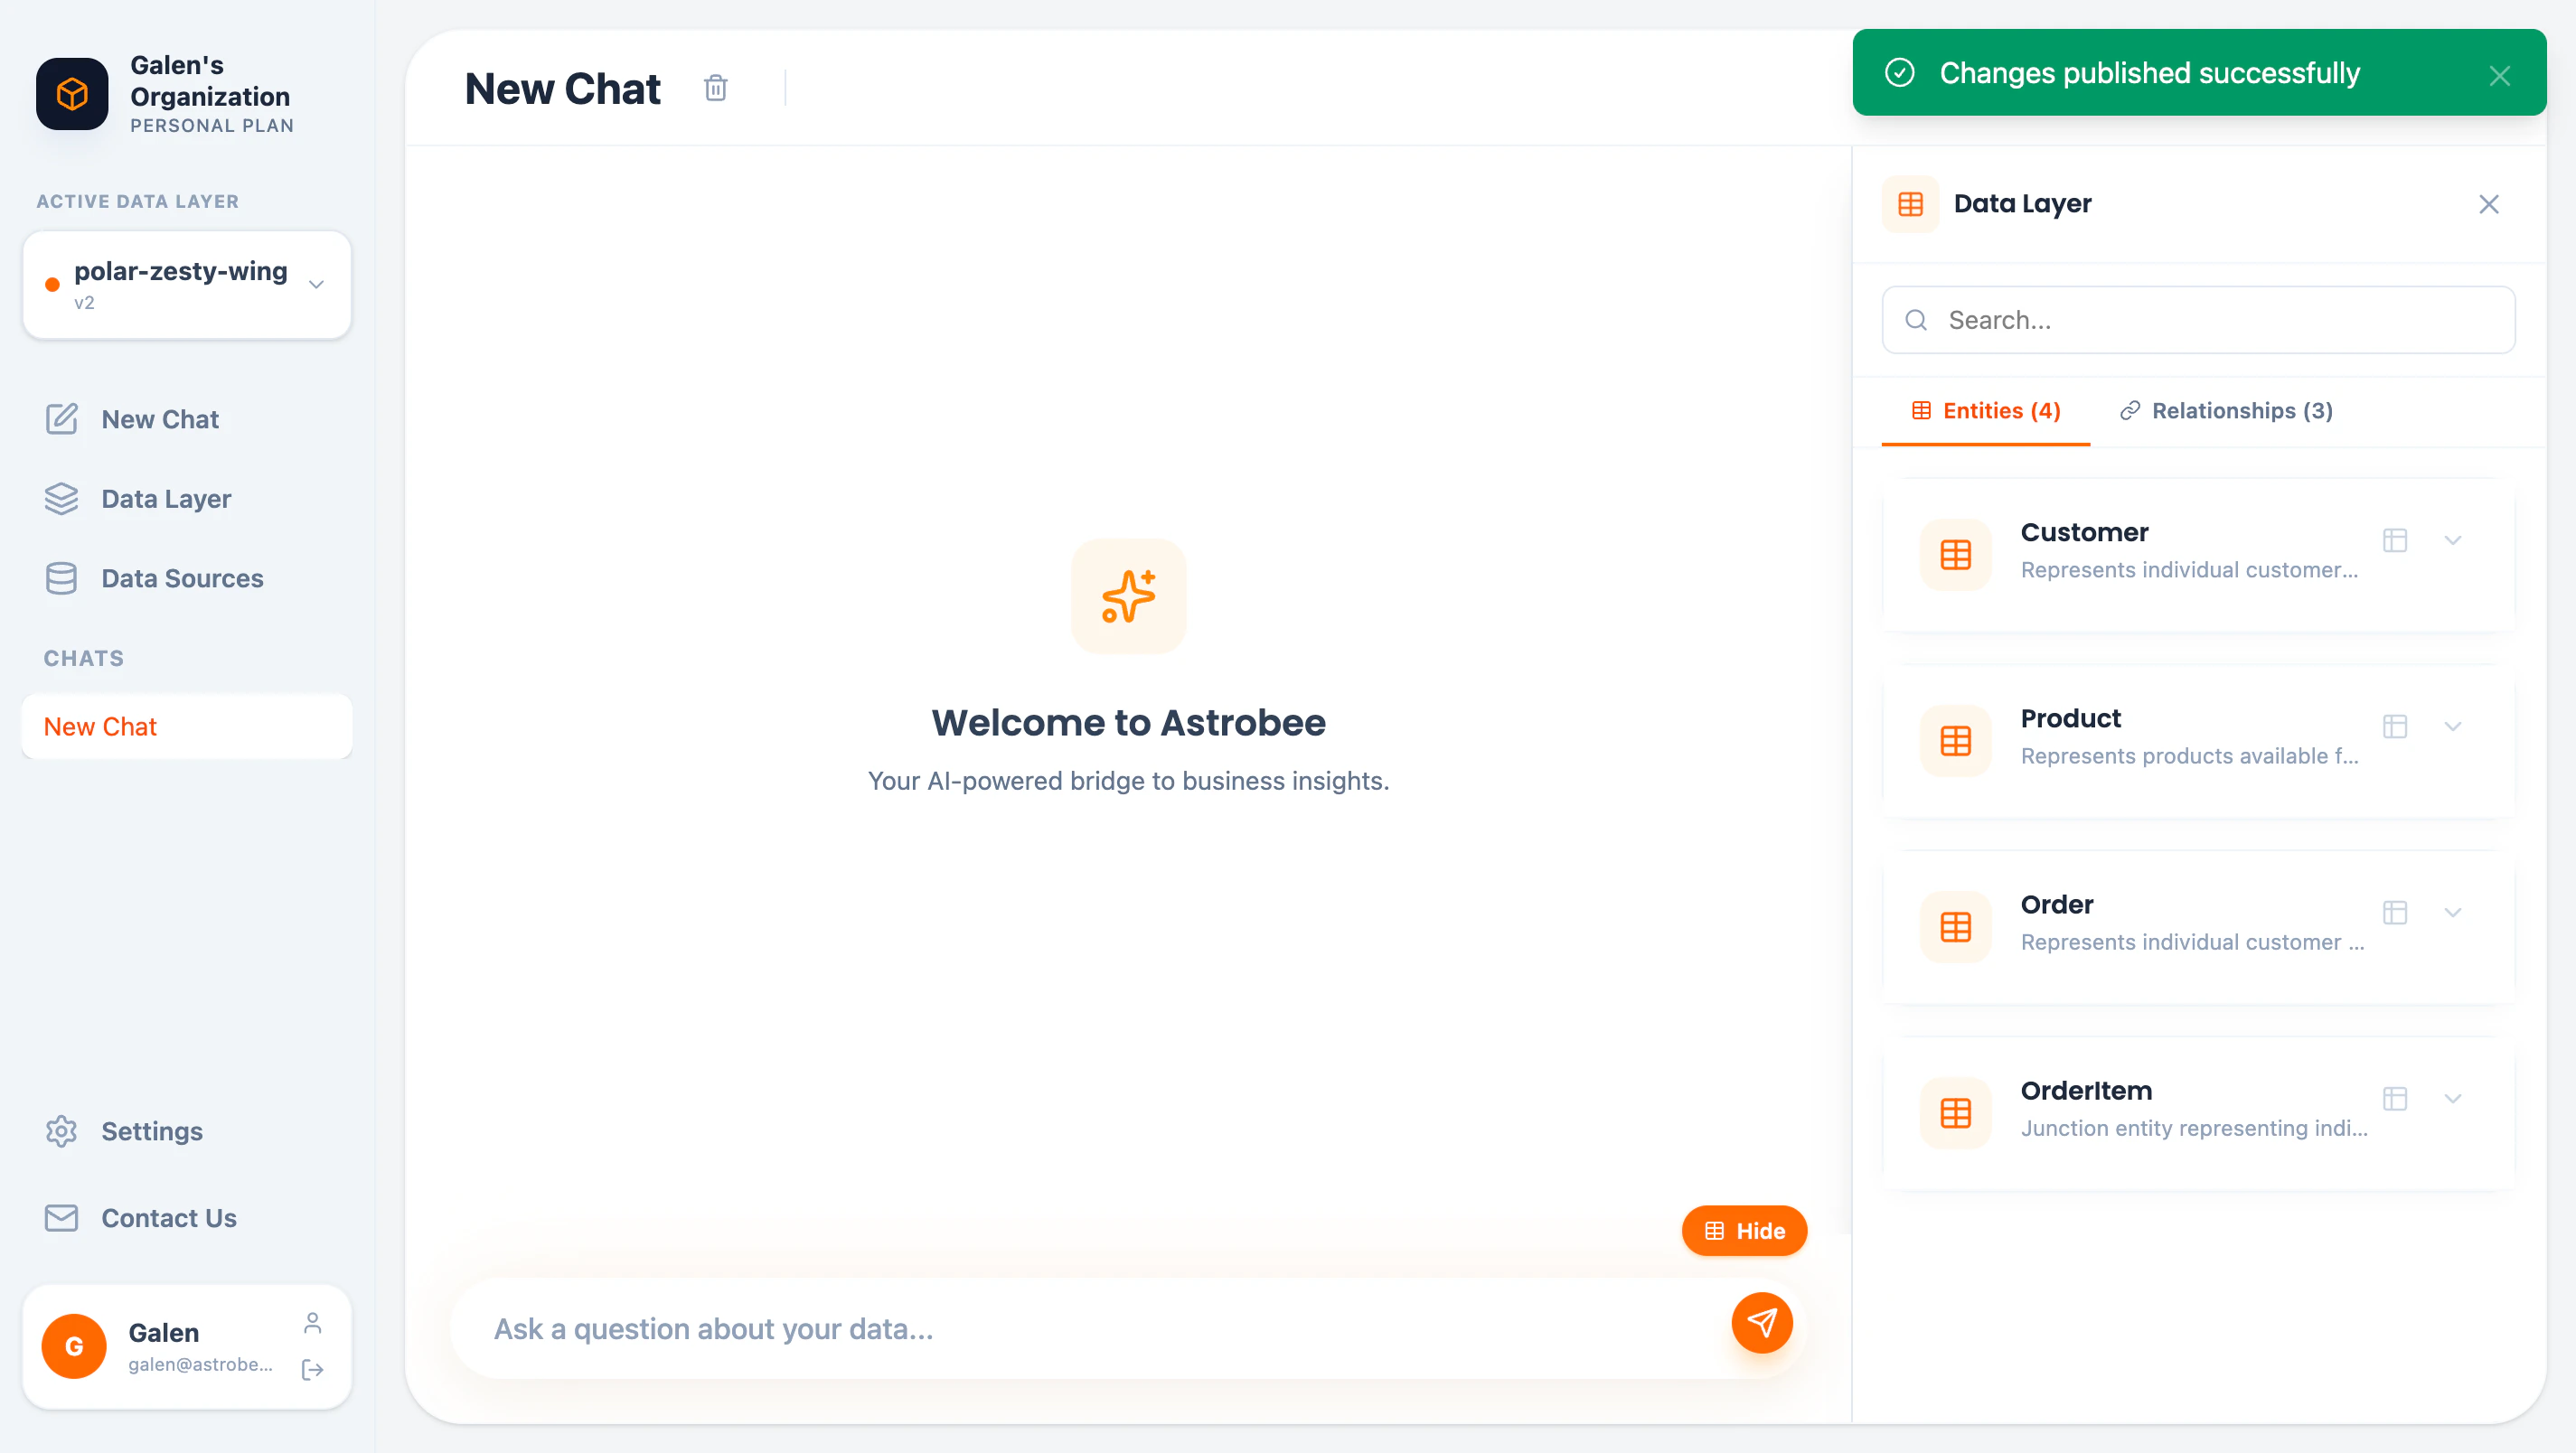
- All entities in your data layer
- Entity descriptions
- Option to preview data or show fields
Chat History
Saved Conversations
All chats are automatically saved and appear in the sidebar under CHATS. Click any chat to continue the conversation.Renaming Chats
Click the chat title to rename it. Descriptive names help you find conversations later.Deleting Chats
Click the delete button next to a chat title to remove it.Question Tips
Be specific
Be specific
“Show revenue by product category” is better than “Show me revenue”
Use time ranges
Use time ranges
“Orders from last month” or “Customers who signed up in 2024”
Ask for comparisons
Ask for comparisons
“Compare revenue between Q1 and Q2” or “Top 10 vs bottom 10 customers”
Request visualizations
Request visualizations
“Show a bar chart of…” or “Visualize…” (coming soon)
Follow up
Follow up
Build on previous answers: “Now break that down by region”
Reporting Issues
If an answer seems incorrect, click Report Issue to flag it for review. Include details about:- What you expected
- What was returned
- Why you think it’s wrong
Limitations
- Questions must relate to data in your connected data layer
- Complex multi-step calculations may require refining your data layer
- Very large result sets are automatically limited
Next Steps
Build Your Data Layer
Define entities and relationships for better answers
MCP Integration
Query from Claude Desktop or VS Code